Splunk is an enterprise-grade software tool for collecting and analyzing log files and other data. Actually Splunk uses the broader term “machine data”:
At Splunk we talk a lot about machine data, and by that we mean all of the data generated by the applications, servers, network devices, security devices and other systems that run your business.
Certainly, log files do fall under that umbrella, and are probably the easiest way to understand Splunk’s capabilities. The company offers a free license which has some limitations compared to a paid enterprise license, the most significant limitation being a maximum of 500 MB/day of indexed data. (For more details, see the differences between free and enterprise licenses.) To learn Splunk, or to use it for personal or smaller sites, the limitations are manageable and the free product is a great option.
In this example I’ve uploaded logs from a couple of my websites and let Splunk index them. I also explain the process I used to identify a rogue user agent which I later blocked.
To get started with Splunk, visit the download page and get the appropriate version for your platform. Follow the installation manual (from the excellent documentation site) to get the software installed and configured.
There are several ways to get data into Splunk; for this case I told it to monitor a local directory for files and manually told it the host name to expect. Then I copied down about 6 months’ of compressed Apache logs into that target directory. You can repeat this for each site, using a separate directory and separate hostname.
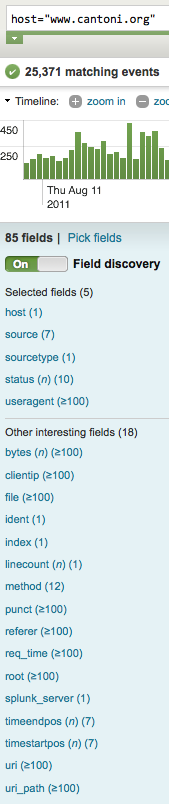
Splunk will quickly index your data which you’ll see in the Search application. I suggest going through their quick overview to help learn what’s going on. Click on a hostname to start viewing data that Splunk has indexed. Because Splunk automatically recognizes the Apache log file format, it already knows how to pull out the common fields which you can use for searching and filtering, as shown in this screenshot:
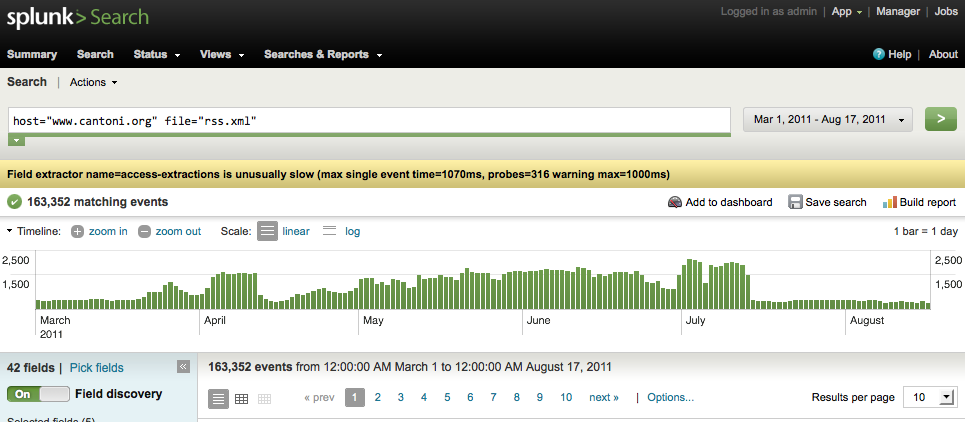
In my case after poking around a bit, I noticed a pretty high amount of traffic fetching my RSS feed file (/rss.xml). The screenshot below shows the number of daily requests, normally hovering around 400 but peaking at about 2,000 per day (click for larger image):
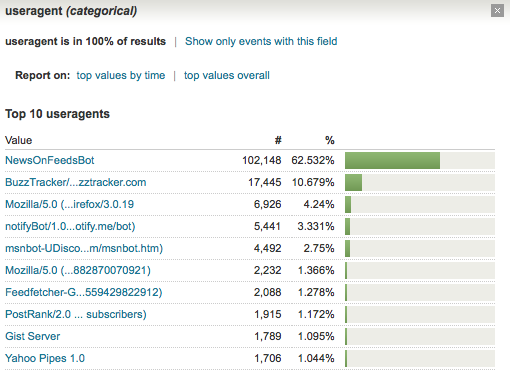
By clicking on the useragent field, I found that an agent named “NewsOnFeedsBot” was accounting for over 60% of the total requests (click for larger image):
Once I filtered on just the NewsOnFeedsBot useragent, some more details emerged:
- The HTTP status code for all requests was 200, meaning it was doing a full request of the 36KB file each time. (Whereas a well-behaved bot would use if-modified-since or other techniques.)
- All requests were coming from a single IP address
- The bot was basically continuously fetching the RSS file several times a minute
Blocking this poorly-behaving bot was just a matter of checking for the useragent string and returning a 403 Forbidden response. After I made the change, the bot made a handful of further requests, received the 403, then stopped. At least it has some logic that indicated it should give up trying to fetch this file.
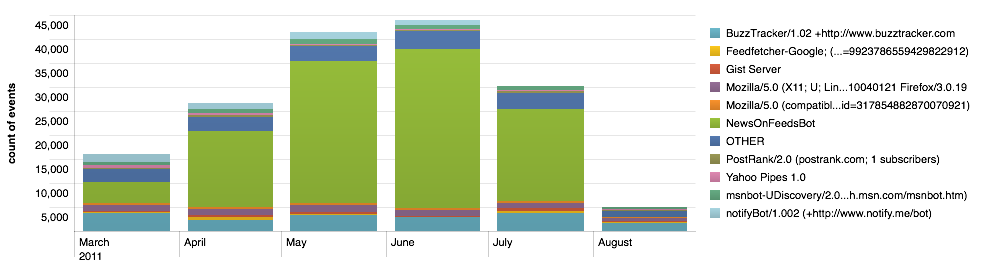
It’s been about a month since I blocked this bot, so I wanted to see an overview of the results. Splunk has a nice built-in charting capability which I used to stack the most popular useragents (again, just for the rss.xml file) and show their portion of visits over the past few months. You can see in the picture below that NewsOnFeedsBot was by far the biggest contributor over the summer, but now it’s gone (click for larger image):